


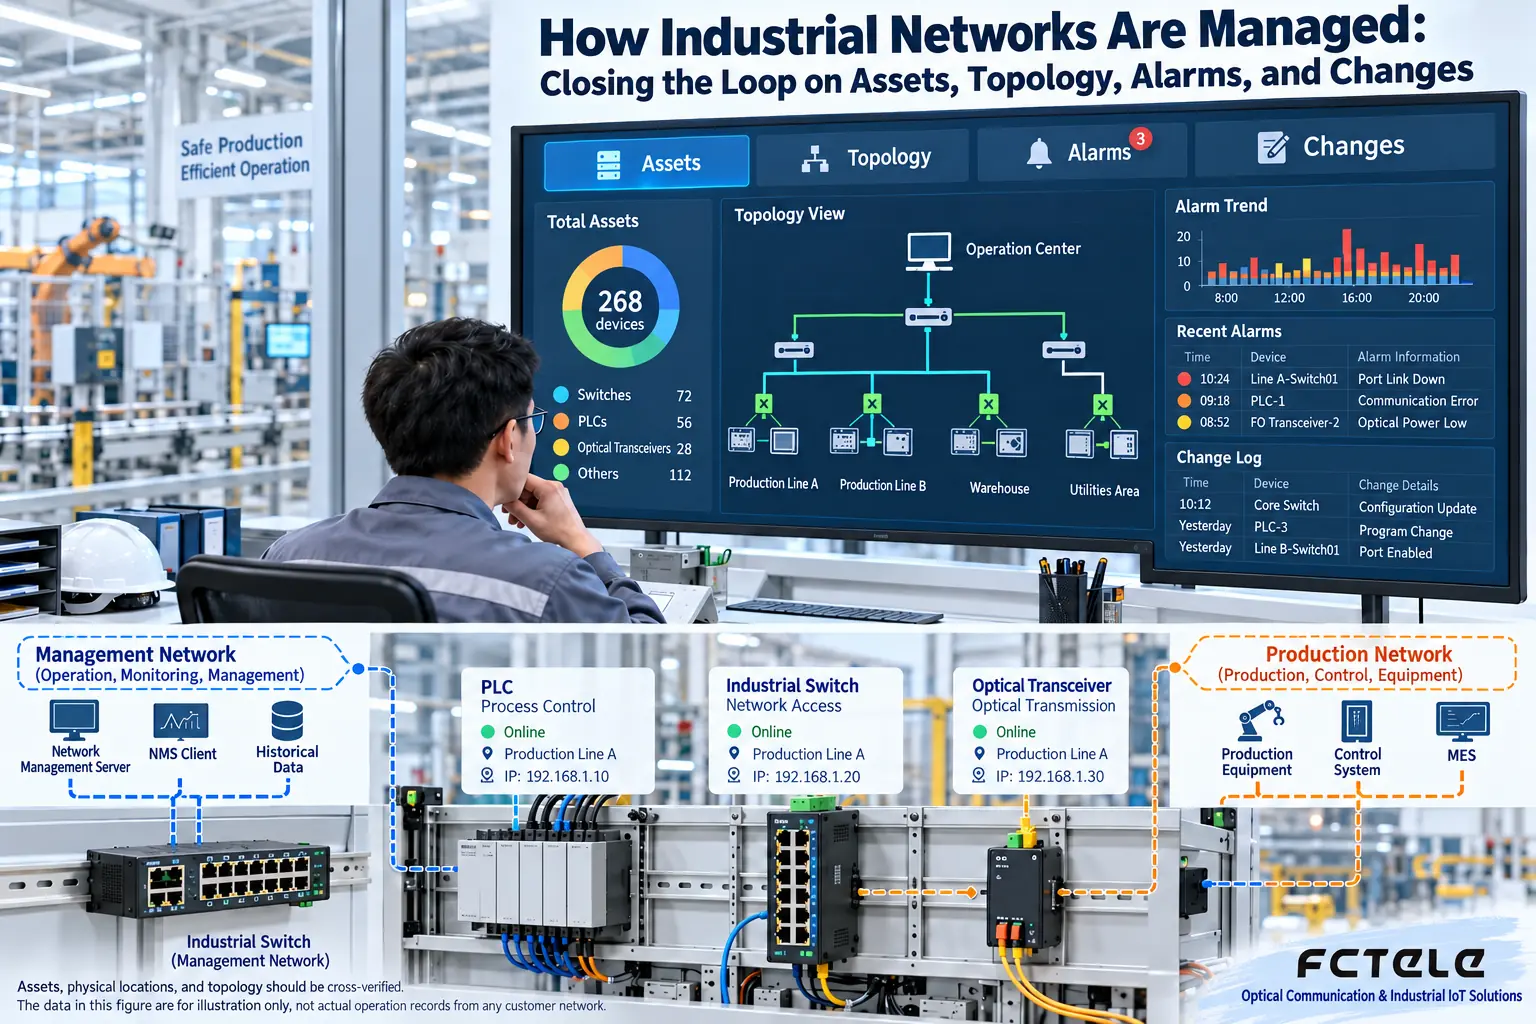
Industrial network management is not just drawing a topology. It links assets, links, status, alarms, and change records to help maintenance staff determine “which device, which port, and when something changed.” Industrial IoT platforms focus on production data and applications, while network management systems focus on communication infrastructure. The two can work together, but they cannot replace each other.
Only with trustworthy assets can there be a trustworthy topology
Create an equipment ledger for switches, fiber optic transmission devices, gateways, PLCs, and other devices. Record location, model, firmware, management address, port purpose, and maintenance responsibility. Physical labels should match the ledger. An IP address is not a device’s permanent identity; duplicate addresses or device replacement can both cause misidentification.
Topology discovery can use information provided by devices, such as LLDP or corresponding management data, but the results depend on supported capabilities and permissions. Non-managed devices, dedicated service interfaces, and some transparent optical links may not be fully discovered and need manual supplementation. Automatically drawn lines are not a natural substitute for as-built construction drawings.
How a network management system obtains device status
Common methods include periodic polling, event notifications, logs, and device APIs. SNMP can read management objects exposed by devices. Notifications such as Traps help detect events in time, and Syslog records corresponding logs. The items available depend on model, firmware, and MIB support. You cannot assume that all services can be monitored just by installing a platform.
For optical links, some devices or modules can provide digital diagnostic data, but devices that do not support it will not produce optical power values out of thin air. Diagnostic readings should also be combined with module documentation and on-site measurements. For video or telephone fiber optic transmission devices, the network port may be used only for management, and the service itself may not pass through the switch as ordinary Ethernet traffic.
Status should be compared as trends, not just red and green lights
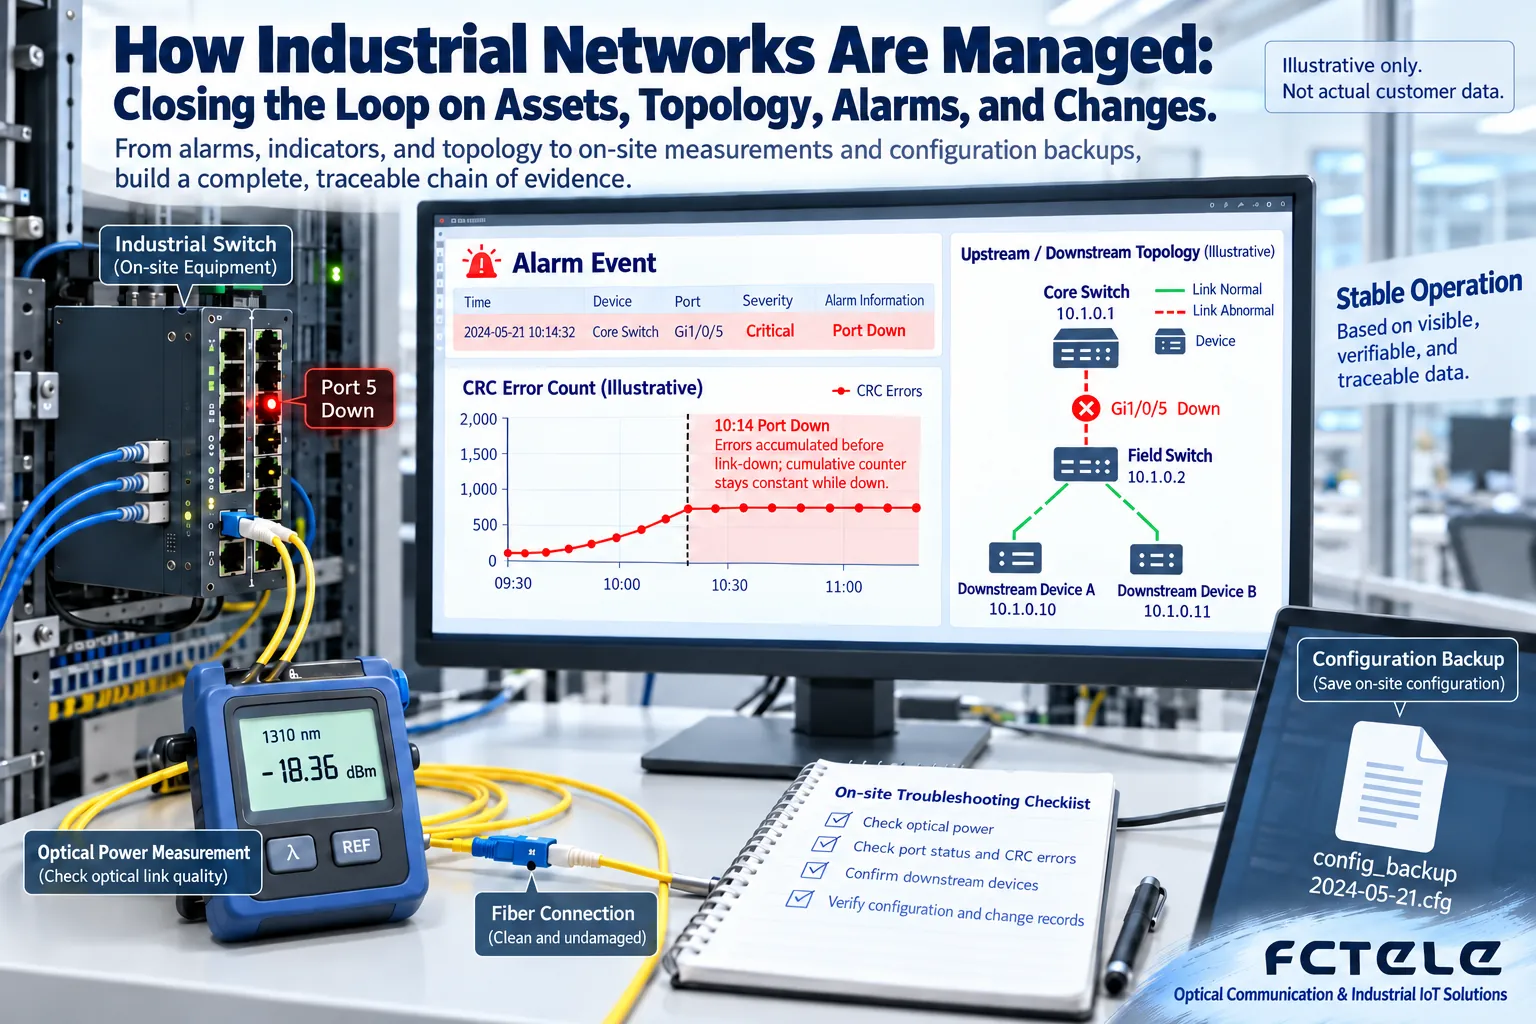
Port Down, discard counters, CRC errors, traffic utilization, and power supply status answer different questions. Error counters may be cumulative values. Pay attention to the increment within a time interval and identify device restarts or counter resets. Without first unifying time and sampling intervals, the sequence relationship between charts may be distorted.
For example, if errors on an uplink continue to grow while multiple downstream terminals intermittently drop offline, first correlate the common link and device rather than treating each terminal alarm as an independent fault. However, this correlation is a troubleshooting clue and still needs cable, port, or device testing to confirm. The platform cannot directly declare the sole root cause.
Too many alarms? First establish severity and suppression rules
Distinguish outages that affect production, elevated risks, and ordinary information. Configure reasonable thresholds, durations, and recovery rules. Brief fluctuations do not necessarily require repeated notifications to everyone, and planned maintenance periods should be marked as maintenance windows. However, suppression rules must not hide real long-term abnormalities.
An alarm message should at least include the device location, port, event time, and related status, along with a maintenance contact or troubleshooting entry point. A notification that only says “there is a red light” is hard to act on. Recovery notifications and handling records are equally important, as they help determine whether the issue is a temporary recovery or a closed loop.
How industrial IoT and network management data work together
IoT or SCADA systems may record output, temperature, and equipment operating conditions, while network management records communication resource status. After time synchronization on both sides, you can compare whether business abnormalities and network events occur together. For example, slower data updates may come from the network, but they may also come from PLC scanning, gateway polling, or application processing. Do not directly equate production delay with network congestion.
Through standard interfaces or reviewed data integration, map network asset identifiers to production equipment. Do not arbitrarily change control network paths just to connect to a platform, and do not directly expose production ports to the internet. Collection should evaluate frequency, load, permissions, and on-site compatibility.
Management permissions and changes are more important than a beautiful large screen
When supported, prioritize management methods with authentication and protection capabilities, such as appropriate SNMPv3 security levels, SSH, or HTTPS, and restrict access sources. Reading status and modifying configurations should use different permissions. Shared high-privilege accounts easily lose accountability records. Specific security capabilities need to be checked against device implementation.
Back up configurations before changes. Clarify impact, implementation time, verification, and rollback conditions. Record differences after modification. Automated deployment also cannot bypass approval and verification. The network management system itself must back up its database and configuration, maintain accounts, and apply patches. Otherwise, it will become a new single point of risk.
Construction can start with key equipment ledgers, port status, and logs, then gradually add topology, trends, and business correlation. For acceptance, use controllable events to test alarms, recovery, historical queries, and permission boundaries, rather than only accepting screenshots of a large screen. Budget should first serve the goals of being locatable, maintainable, and recoverable.
References:Cisco: SNMP secure deployment.
Translated from the Chinese technical article. Source first published: 2023-05-06. Source last revised: 2026-10-13T23:07:12+08:00. Read the Chinese source
