


When an optical link between two factory buildings stops working, the fiber may run a long way through cable trays. Must every section be opened to find the problem? An optical time-domain reflectometer, or OTDR, observes optical changes along the link from one end and helps narrow the search. It does not photograph the fiber or ask the remote device to reply with a data message. It sends short light pulses and observes light that comes back. Understanding why it can locate events—and why some events are hard to see—is more useful than simply reading a fault distance.
1. Separate the measurement from normal communication
A fiber media converter or switch optical port carries application traffic. Its received optical power can indicate whether enough light is arriving, but normally does not identify which connection along the route is faulty. An OTDR is a measuring instrument that explores the fiber with light. It organizes return strength and arrival time into a trace, where connections, changes in loss and the end of the fiber leave clues.
Before testing, confirm the fiber type, connectors, test wavelength and permission to test. Isolate the service according to the instrument instructions and network maintenance procedures. An ordinary offline test must not be connected casually to an operating optical port; live-fiber testing requires suitable equipment and conditions. Never look into a port or fiber end. Use appropriate inspection and cleaning tools. This article explains conventional glass fiber in general, without inventing instrument accuracy or range.
2. Why light comes back from inside the fiber
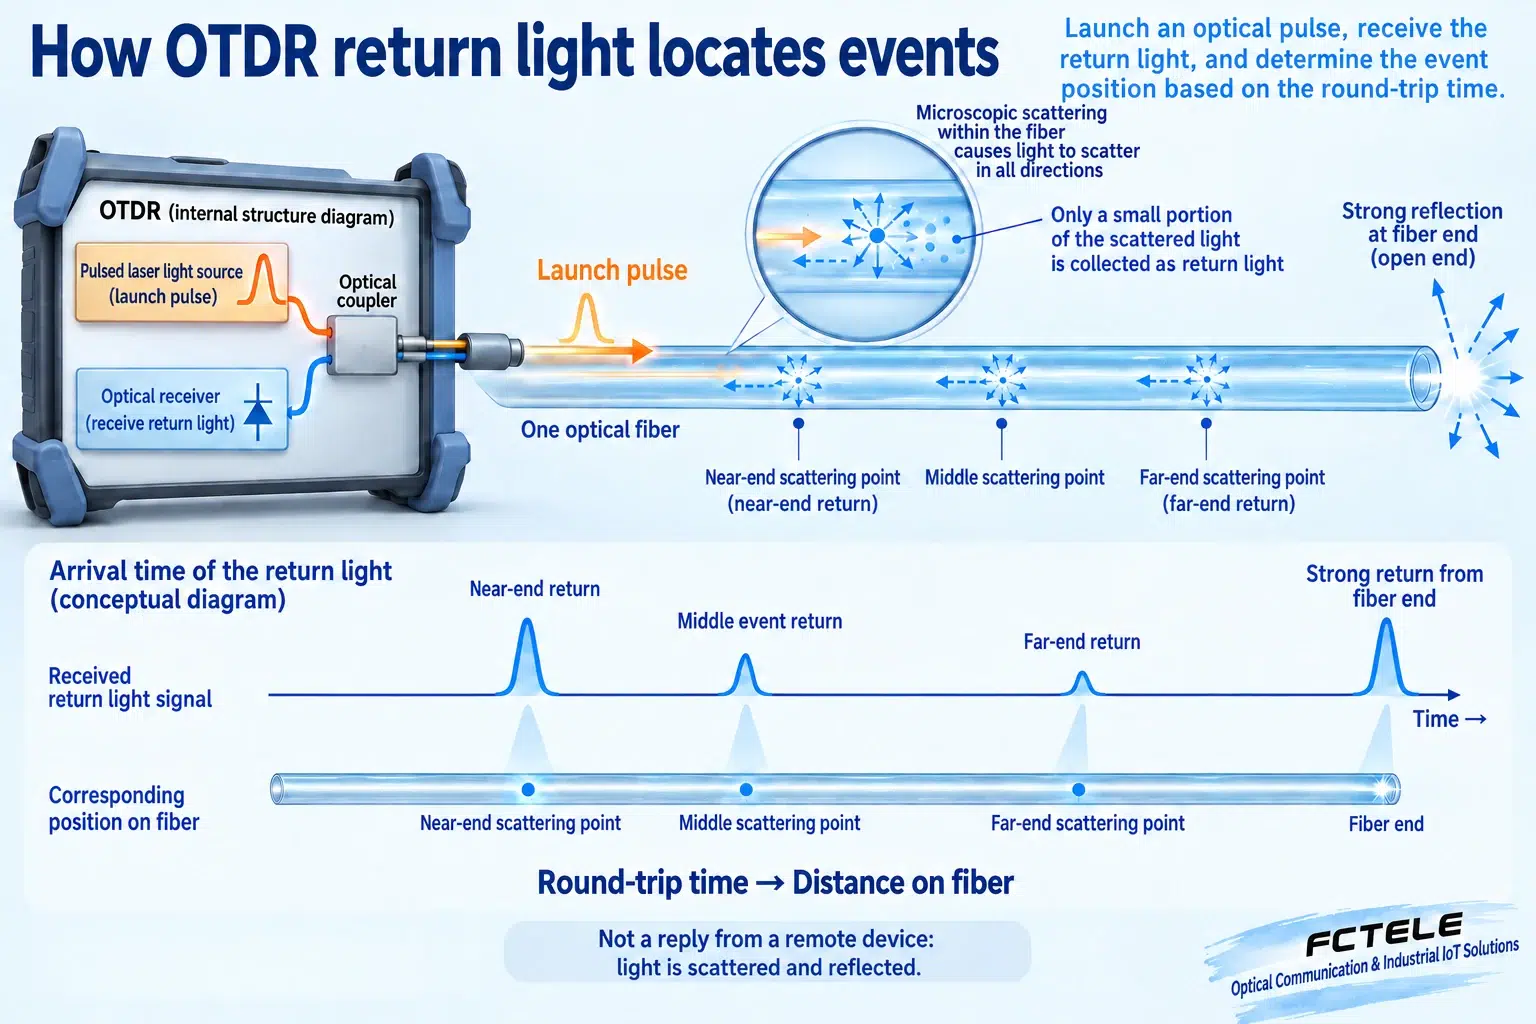
Glass fiber looks uniform, but its microscopic structure contains small variations. As a pulse travels through it, a tiny fraction of its light scatters in different directions. The portion that returns toward the instrument is called backscatter. Normal fiber sections generate this weak return continuously, so the instrument can observe the route without installing an active responder at regular intervals.
Connections and open ends can introduce more pronounced optical boundaries and produce a stronger return, called reflection. This differs from the weak scattering along the fiber. A corridor with quiet background sounds and one obvious echo is a useful analogy, but the real process involves light, not sound. A strong reflection also does not mean that useful communication passes through that point particularly well.
Inside the instrument, transmission and reception are separate functions. A laser produces short pulses; optical components direct them into the fiber and route returning light toward a detector. The detector records how return strength changes over time, and processing software builds the trace. The same test fiber carries both the outgoing pulse and returning light. This is not a pair of traffic fibers or two optical transceivers exchanging replies.
3. How an earlier or later return becomes a position
A pulse that travels to a nearby point and back takes less time than one returning from farther away. The instrument converts this round-trip time into distance using the propagation speed for the fiber. Both outward and return travel are included; the measured interval is not a one-way travel time. Settings such as the fiber refractive index also matter. An incorrect value can shift the displayed location.
Fiber distance is not the same as a straight-line distance on the ground. Cable-tray turns, spare coils and patch cords add optical length. Match the displayed location to drawings, connection identifiers and route records before opening a suspect area. Ignoring a spare coil may send a technician to the wrong part of the tray. The measurement narrows the search, but the physical correspondence must still be checked.
The instrument can collect many pulses and average the returns, making stable events easier to distinguish from random noise. A longer acquisition may improve visibility, but cannot provide unlimited resolution between overlapping events. Range settings, pulse width and acquisition time work together; no single setting establishes everything the instrument can resolve.
4. What peaks, steps and slopes can tell you
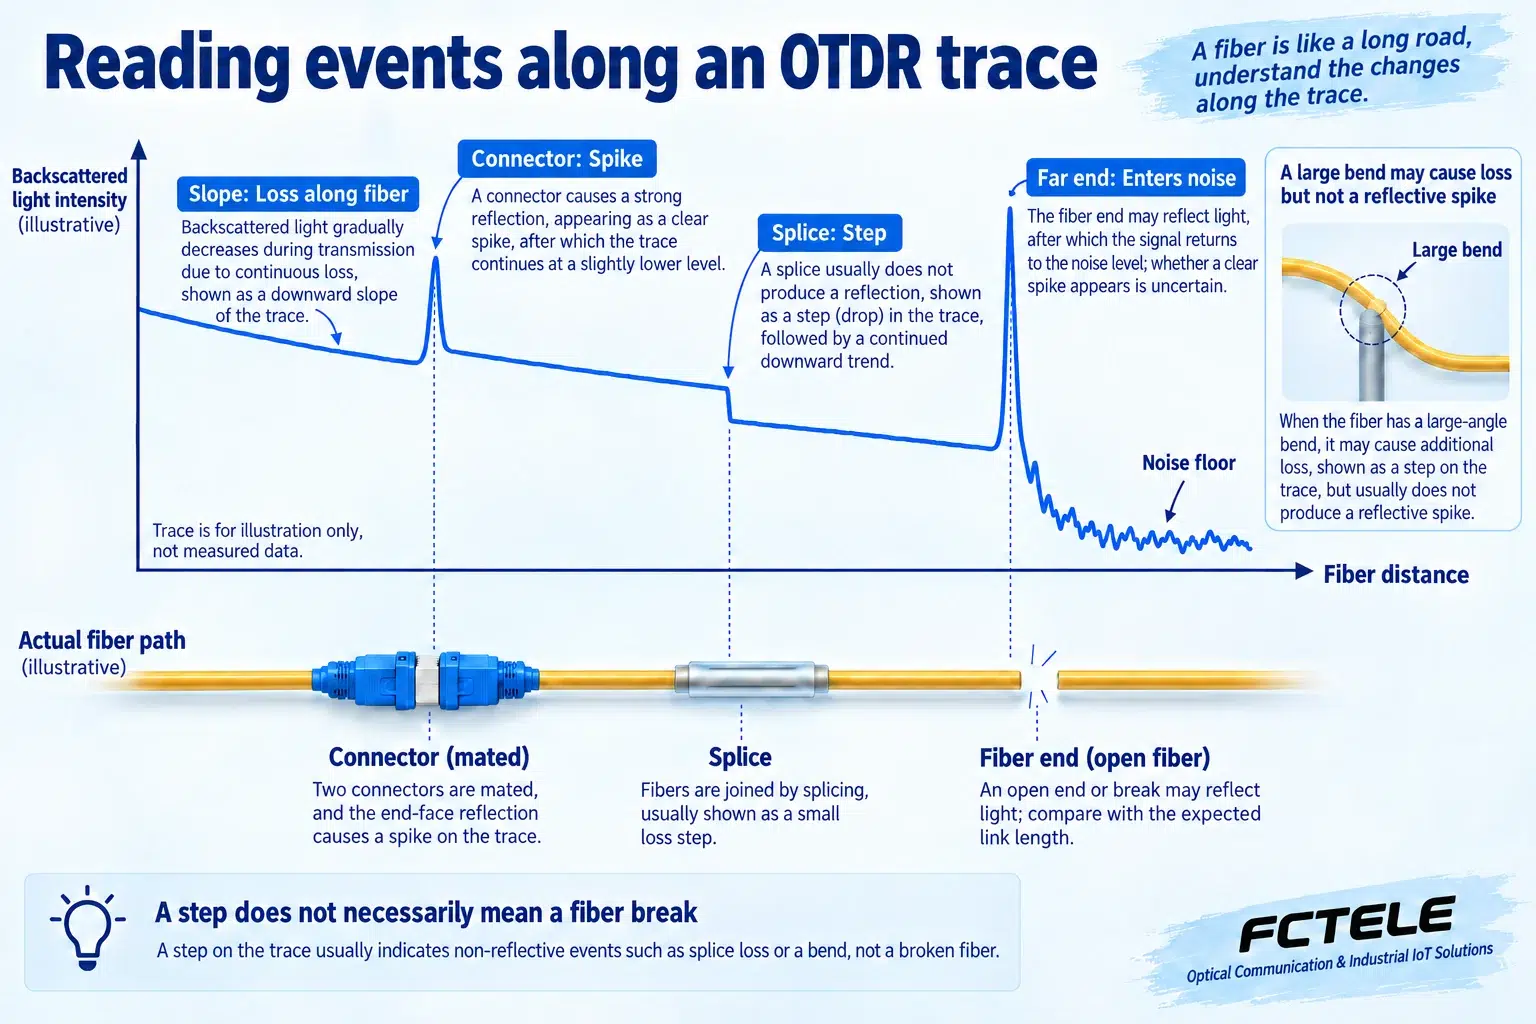
The horizontal axis shows distance along the fiber; the vertical axis represents returning light strength. A normal section commonly slopes downward with distance. A reflective event may create a peak. A loss event with little reflection, such as a splice or bend, may appear as a downward step. Examine the fiber before and after an event rather than focusing only on its highest point.
Beyond the visible end, the trace enters a region without a sufficiently identifiable return signal. This may be an intentional open end, a break, or a region hidden behind excessive earlier loss. Some breaks have little obvious reflection. Therefore, neither “a peak means a break” nor “no peak means no fault” is a reliable rule. Compare the expected route length, event list and actual connections.
A step is not an automatic diagnosis either. A splice and a bend can both reduce the return level but require different maintenance. Use route records to check whether a connection exists there, compare suitable wavelength tests, and inspect the suspect location under controlled maintenance conditions. The illustration shows conceptual relationships, not FCTEL measurements or universal acceptance limits.
5. Why nearby events may disappear inside a dead zone
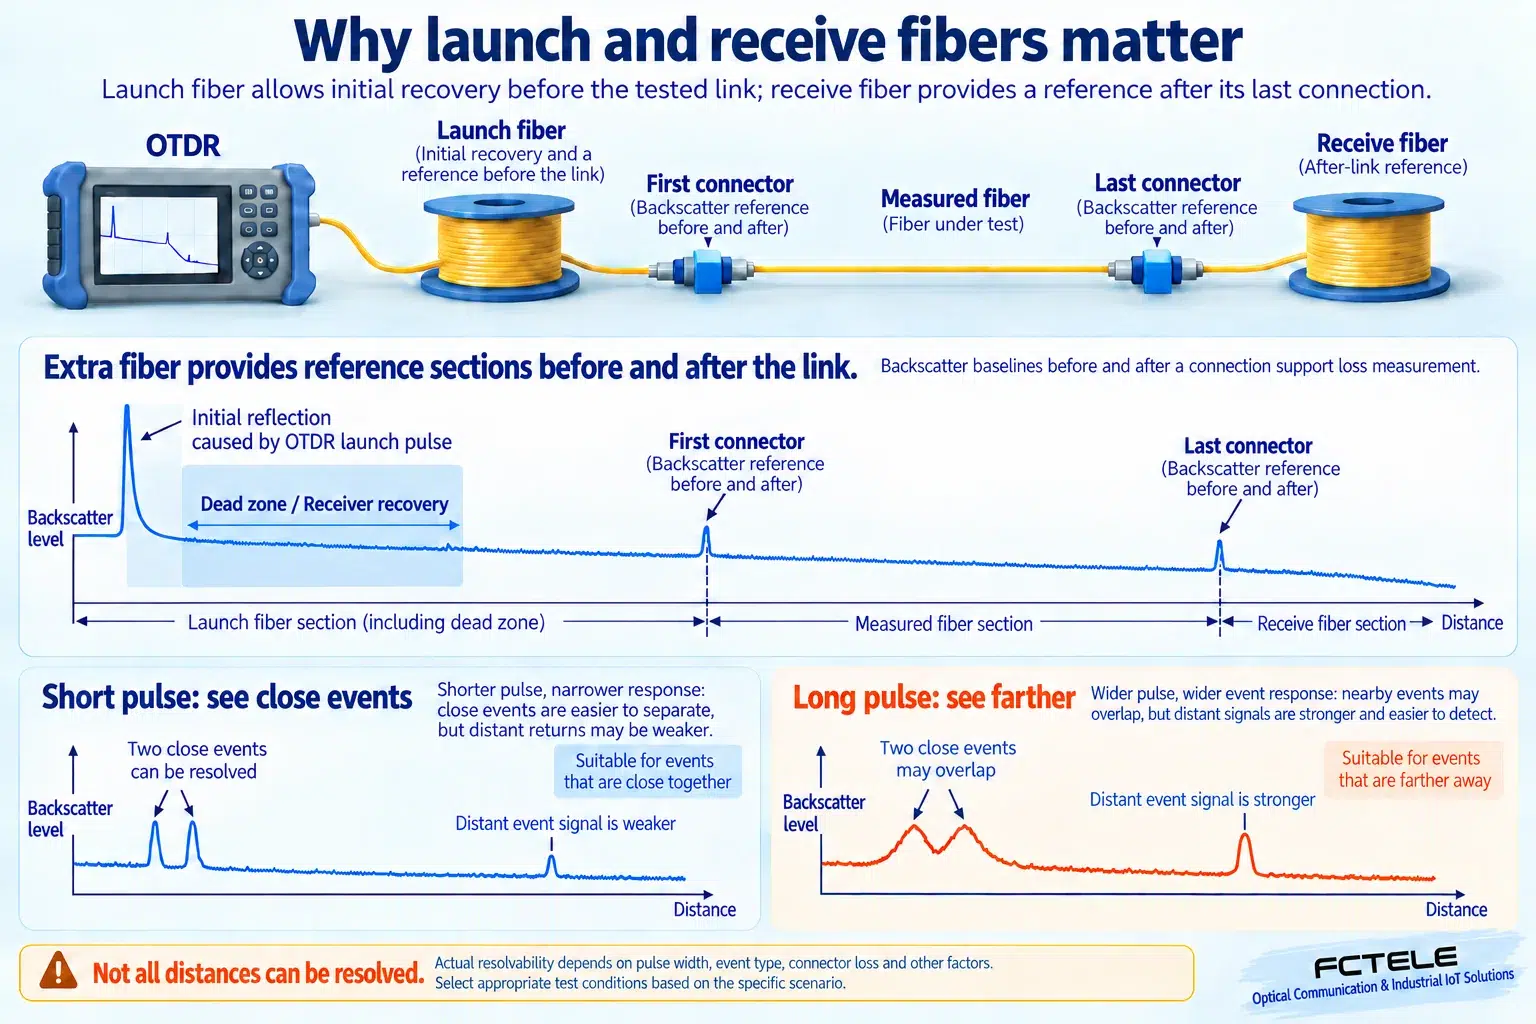
After a strong reflection, the receiver needs time to recover. The light pulse also occupies a finite length in the fiber. A nearby change can be covered by the earlier response. This difficult-to-resolve region is called a dead zone. An event dead zone concerns whether another event can be distinguished; an attenuation dead zone concerns recovery sufficient to compare loss reliably. These are different questions.
A shorter pulse helps distinguish closely spaced events but injects less energy, making distant weak returns harder to observe. A longer pulse can improve distant visibility while blending nearby events together. A brief flash for detail versus a longer illumination for brightness is an analogy for the trade-off. Actual dead zones also depend on reflection strength, receiver behavior and other test conditions.
6. Why launch and receive fibers matter
A launch fiber is a suitable length of test fiber between the instrument and the link. It lets the initial reflection recovery occur before the tested link and supplies a reference section before its first connection. A receive fiber follows the link and supplies a reference section after its last connection. These fibers help reveal the two end connections; their purpose is not to extend the application link.
Match both test fibers to the measurement requirements. Their lengths must accommodate the actual dead zones and settings, rather than one fixed length for every instrument. Identify the tested link start and end correctly so that test-fiber length and loss are not included in the final link result. Incompatible connectors, dirty end faces or a faulty test fiber can also mislead the measurement.
When needed, measure from the other end and compare the same event in both directions. Different backscatter characteristics between fiber sections can bias a one-direction splice loss reading. Bidirectional comparison supports a better assessment, but conditions and reference methods must be consistent. Averaging two numbers from arbitrary settings does not establish acceptance. Retain the original traces, not only a photograph of the final verdict.
7. Confirm that the optical link and its application have recovered
For a factory link using FCTEL industrial switches and fiber equipment, record the affected optical ports, fiber identifiers and application symptoms, then locate suspect areas under the maintenance plan. Actual interfaces and deployment information come from the relevant product documentation. A normal trace does not prove that a model supports a particular distance, and it does not replace wavelength matching or optical power-budget checks.
After repair, repeat the test on the same link and compare the traces to understand how the suspect event changed. Also verify end-to-end insertion loss by an appropriate method, received power, link stability and real application traffic. An OTDR helps locate events; a light source and power meter support the corresponding end-to-end loss test; operational records confirm application behavior. Each answers a different question.
Record the fiber, direction, wavelength, pulse settings, test-fiber boundaries and repair details so the next technician knows exactly what was measured. Return light provides clues along the route, round-trip time locates them, trace shapes require interpretation, and dead zones limit which details are visible. Understanding these roles prevents an attractive trace from becoming an unconditional claim that the whole communication system has passed.
Technical references: EXFO: OTDR principles and return light; EXFO: testing terminology; Fluke Networks: event and attenuation dead zones; Fluke Networks: fiber troubleshooting; EXFO: launch and receive fibers. Related resources: Technical Articles and FCTEL industrial switch documentation (Chinese). Original AI-assisted illustrations explain generic principles, not product internals or measurements.
