


FCTEL Original Technical Article · FCTEL Technical Team
First published: 2026-10-05 · Last modified: 2026-10-05
A port utilization chart looks quiet, yet a machine-vision image occasionally loses frames and a PLC response suddenly slows down. One possible cause is a microburst: several devices send toward the same output in a short interval. The switch cannot transmit everything immediately and must temporarily store frames; insufficient buffer space can lead to drops. This article follows reception, queuing, scheduling and transmission, distinguishing general mechanisms, illustrative calculations and capabilities explicitly documented for FCTEL products.
Open the original image for detail. Scroll horizontally to read the diagram labels at full size.
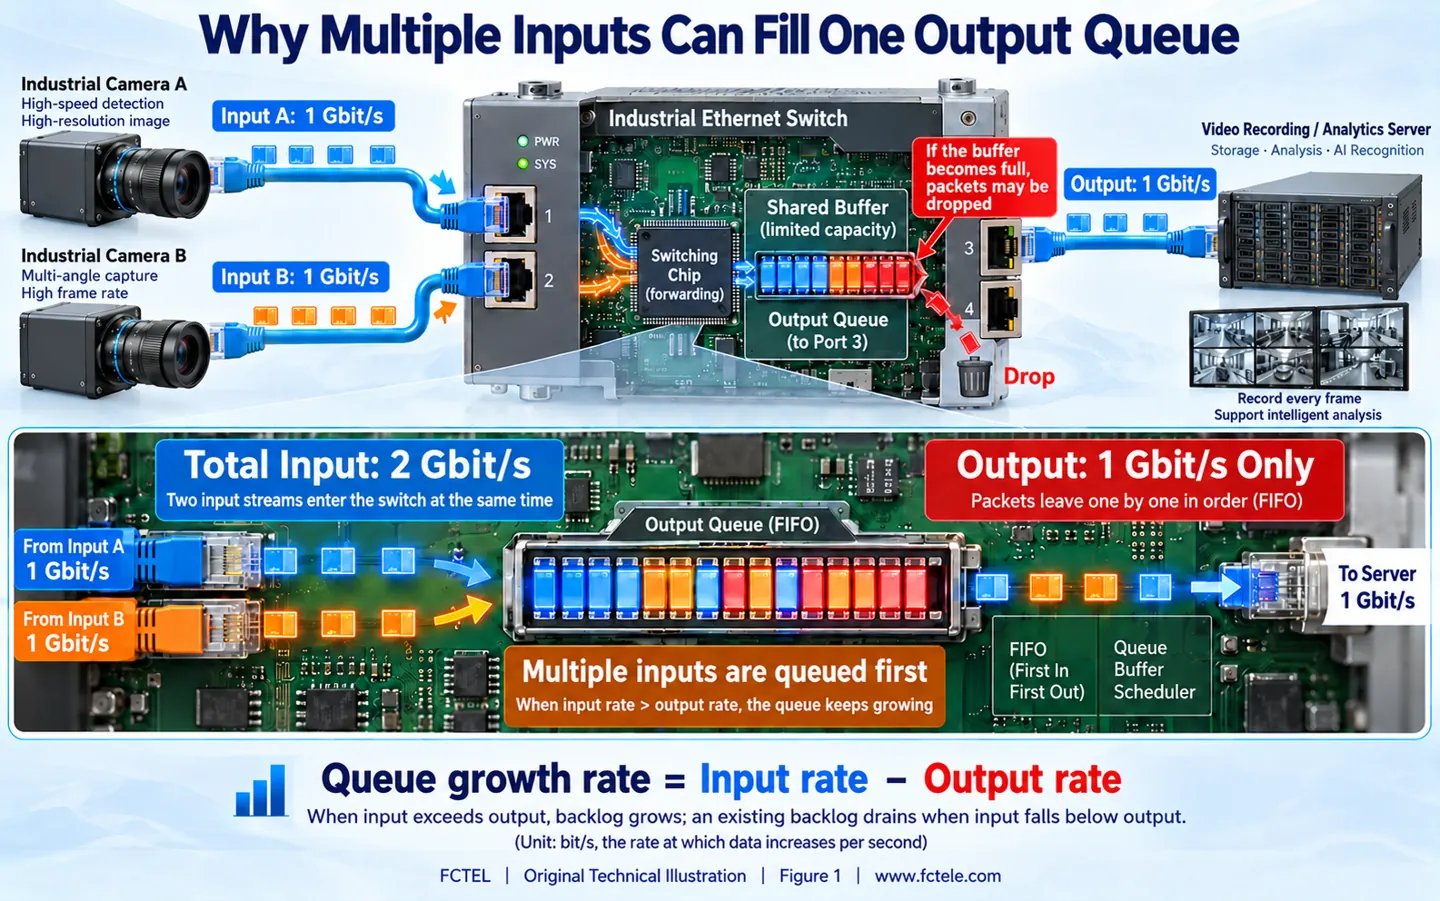
1. Why Several Gigabit Inputs Can Contend for One Output
After receiving an Ethernet frame, a switch determines its output using the applicable forwarding table and policies. Multiple inputs can receive simultaneously, but one ordinary physical output still serializes frames at its line rate in a given transmission direction. When two cameras send images to the same analysis server, both connections may negotiate gigabit operation while competing for the server’s single gigabit switch port. Adding inputs does not enlarge that output’s capacity.
A buffer is storage for frame data; a queue is the waiting data and the management relationship used to serve it. These are related but are not interchangeable concepts. A switching chip may use shared storage, port allocations and multiple traffic queues. Its allocation rules determine how much space an output can use at that moment. A product’s total buffer specification does not mean every port has that amount exclusively, nor does it directly specify how long a particular application may wait.
The situation examined here is output load temporarily exceeding service capacity. It differs from a loop continually replicating frames and from interference corrupting a frame on a copper link. Establish the congestion location and traffic direction before attributing every loss event to a cable or a failed switch.
Open the original image for detail. Scroll horizontally to read the diagram labels at full size.
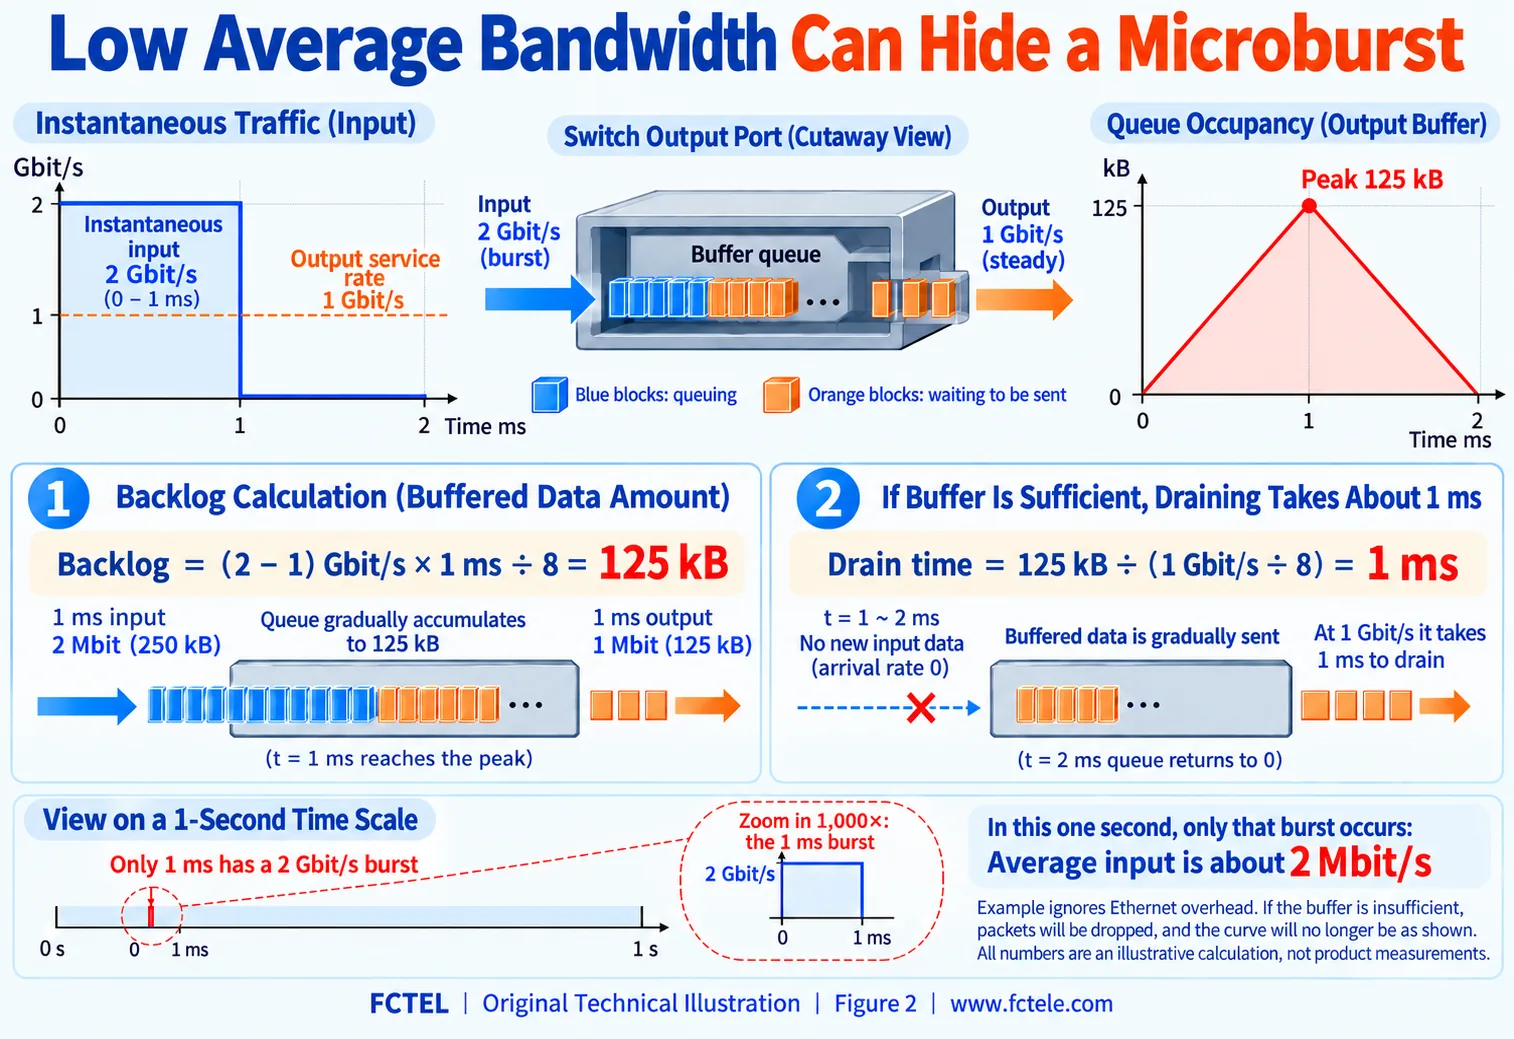
2. How a Microburst Escapes Average Utilization Charts
An average rate is the number of transmitted bits divided by the measurement interval. In a one-second interval, a one-millisecond burst is diluted by the remaining idle time. Longer intervals can hide peaks more easily. Synchronized camera triggers, block uploads and simultaneous device reports can cluster traffic in time. There is no single microburst-duration threshold applicable to every device; the relevant condition is instantaneous arrival exceeding the output’s service rate.
Consider an ideal calculation. Two inputs deliver a combined 2 Gbit/s for 1 ms to an initially empty queue, while the output transmits at 1 Gbit/s. The difference is 1 Gbit/s. Multiplying that difference by time and dividing by eight gives 125,000 bytes, or approximately 125 kB, of backlog. Once input stops, draining it at 1 Gbit/s takes about another 1 ms. The triangular queue-occupancy graph assumes sufficient buffering and ignores preamble, inter-frame gaps and other traffic.
If this is the only burst in that second, the arriving data totals 250 kB and average input is only about 2 Mbit/s. Nevertheless, the burst requires buffering for 125 kB during its one-millisecond arrival interval. If available allocation is smaller, drops begin sooner and the occupancy curve is clipped by the capacity limit. Low average utilization therefore neither proves the absence of instantaneous congestion nor rules out output drops.
3. Buffering Absorbs Bursts and Adds Waiting
A frame in an output queue must wait for work ahead of it to finish. Multiplying queued bytes by eight and dividing by output rate estimates service time. Actual behavior also depends on frame boundaries, link overhead and scheduling. Larger buffers can absorb longer short-term bursts but may also let frames wait longer. When sustained input exceeds output, every finite buffer eventually fills; additional storage does not eliminate a persistent capacity deficit.
Behavior when storage is exhausted depends on implementation and policy. Common tail drop rejects newly arriving frames when the queue is full, but other thresholds, priority rules or early-drop mechanisms may apply. Do not assume one chip’s strategy is the default for every industrial switch. TCP may recover data through acknowledgement and retransmission while the application experiences additional waiting. UDP and some real-time applications require their own loss or timeout handling.
Link-layer flow control has boundaries too. Verify whether it is enabled, whether the peer responds, which traffic it affects and whether it propagates blocking to other applications. Enabling flow control is not a replacement for control-network capacity planning. Without validation, pause frames cannot be assumed to guarantee PLC deadlines.
Open the original image for detail. Scroll horizontally to read the diagram labels at full size.
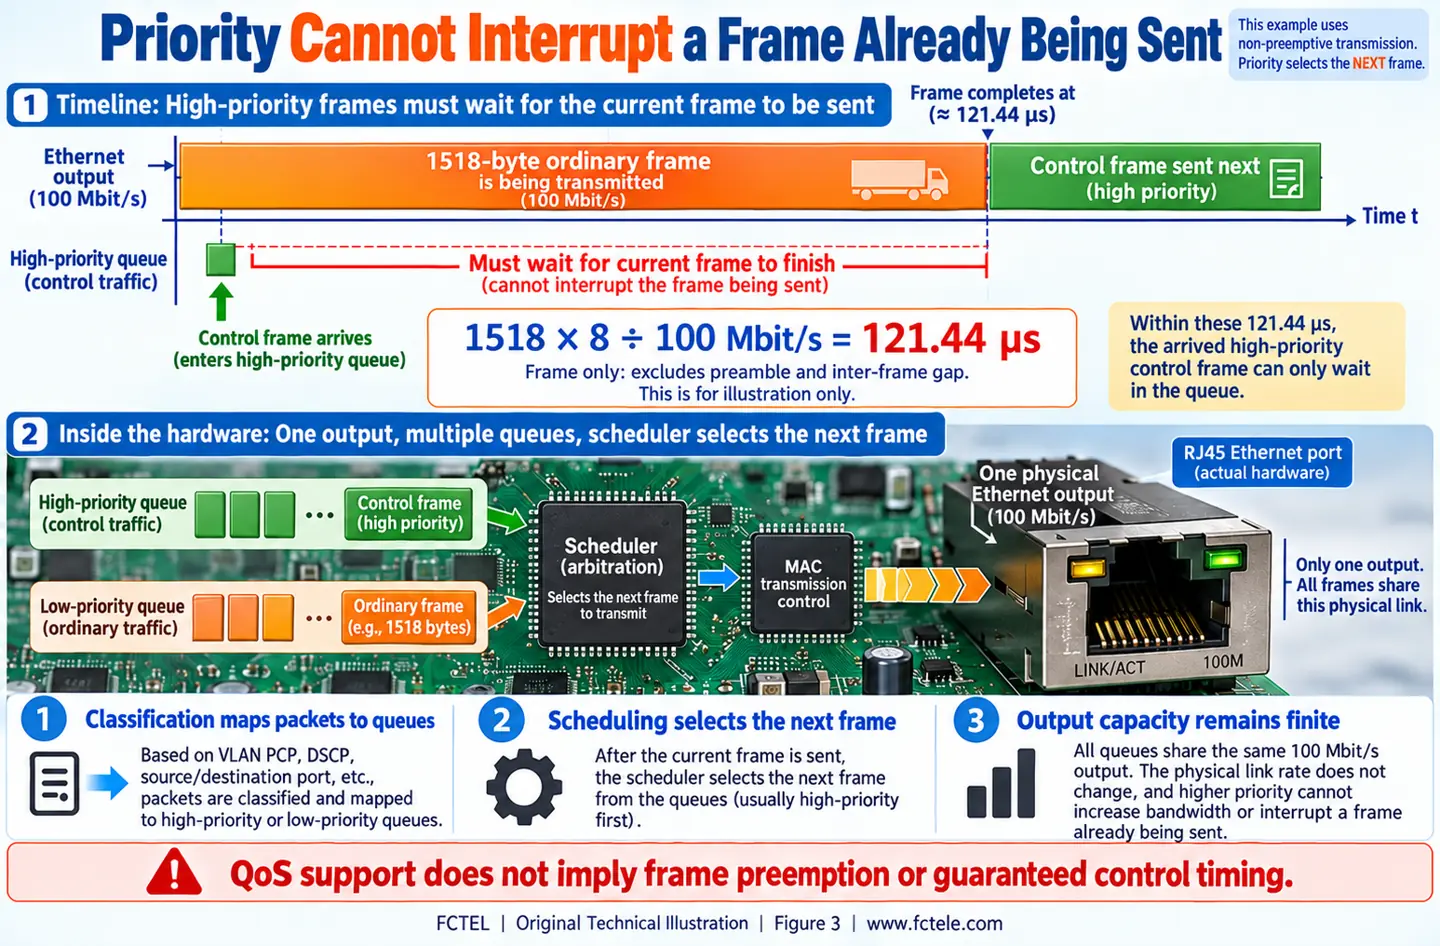
4. Why QoS Is Not a Zero-Delay Guarantee
QoS generally classifies traffic using conditions such as port, IEEE 802.1p priority or IP DSCP, maps it to internal queues, and lets a scheduler select the next frame. A marking is classification information. Without matching mapping and scheduling along the path, a marked frame does not necessarily receive preferential service. Strict-priority and weighted scheduling provide different fairness properties. Check the algorithm, queue count and rate controls for the specific model and firmware.
With ordinary non-preemptive transmission, a short control frame can enter a high-priority queue after the output has begun sending an ordinary frame. The scheduler normally waits for that frame to finish before choosing the control frame. A 1,518-byte frame takes approximately 121.44 microseconds to serialize at 100 Mbit/s, excluding preamble and inter-frame gaps. At 1 Gbit/s the same frame-only calculation gives approximately 12.144 microseconds. These are illustrative calculations, not promised device latency values.
Dedicated Ethernet frame preemption requires the relevant capabilities, configuration and peer cooperation. It cannot be inferred from a statement that QoS is supported. Even high-priority control traffic can contend with other control traffic, while other stages add waiting. Deterministic design starts with the application’s maximum tolerable delay and peak load, validates each segment, and avoids assigning every frame the highest priority.
5. Separate Congestion from Physical-Link Errors
First preserve port speed and duplex state, input and output byte counters, discard counters, and CRC or FCS error counters. Identify each counter’s direction, unit and refresh interval. Growing output discards often point toward output resources or policy; CRC errors warrant examination of receive-link integrity. Both can occur together. One counter alone does not exclude every other cause. Correlate them with the times of missing application frames or timeouts.
Improve observation time resolution and, where supported, examine queue occupancy, peaks or discard categories. If the device lacks those metrics, use controlled traffic in a test environment to compare one sender, two synchronized senders and staggered sending. Measure counter increments at the same output and application response. A mirror port has its own capacity limit: loss on the mirrored capture path is not automatically loss at the application’s output.
6. A Practical Acceptance Method for FCTEL Equipment
The official FCTEL documentation for its managed DIN-rail Layer 3 industrial switch with four 10-gigabit optical ports and eight gigabit electrical ports lists store-and-forward operation, IEEE 802.1p and DSCP priority-queue management, and port statistics. These documented features provide a product context for design and acceptance testing. They do not establish support for a particular microburst-monitoring feature, frame preemption, or a specified per-port buffer allocation. Verify configuration and available statistics against the corresponding manual and firmware.
Locate the actual bottleneck before evaluating higher output capacity, reduced instantaneous upstream rates, staggered sending and suitable queue scheduling. Link aggregation does not guarantee that one application flow simultaneously uses every member link: check hashing and traffic distribution. Repeat the same peak-load tests after changes and record drops, waiting, application integrity and recovery. Demonstrating improvement within the control application’s limits is what makes intermittent faults under low average utilization understandable.
Technical references: Cisco documentation on microburst mechanisms. Related FCTEL resources: Technical Articles and industrial switch product documentation (Chinese).
