


OPTICAL LEVELS, AT A GLANCE
Why can enough light still be difficult to read?
Average optical power describes overall light, while extinction ratio compares representative high and low levels in a two-level signal. The receiver must distinguish changes over time. Normal average power does not prove a passing extinction ratio, and a passing ratio alone does not establish a good eye or error-free service. Match the interface, observation point and test method before drawing a conclusion.
Separate the levels
ER compares representative high and low optical powers. The low level need not be zero.
Separate the average
An equal average does not identify a unique level pair. Keep pattern and duty cycle conditions clear.
Separate the evidence
A power reading cannot replace waveform testing. Correlate counters, timing and service outcomes.
Identify the interface
Verify rate, wavelength, fiber and host/module compatibility from the selected documentation.
Identify the method
Record test pattern, calibration, reference receiver and the actual observation point.
Check the outcome
Compare both-direction power, errors, logs and service behavior under controlled conditions.
Selection and verification checklist — expand
| Check | What to confirm | How to verify |
|---|---|---|
| Scope | NRZ or another optical format | Read the exact optical-interface documentation. |
| Power | Allowed receive range, not ER | Use the correct wavelength setting and both-direction records. |
| Waveform | Levels, timing and calibration | Use a suitable optical test system and applicable method. |
| Isolation | One changed condition at a time | Retain patch-cord and module substitution records. |
| Service | Errors and application recovery | Correlate logs, counters and actual service behavior. |
Conceptual illustrations, not measurements, a particular product architecture or universal acceptance thresholds.
An optical power meter says that plenty of light is arriving. Why might the data still be difficult to recover? Optical communication must do more than deliver light: the receiver must distinguish changes in that light over time. Extinction ratio describes a basic comparison between the light used for a high level and the light used for a low level. Average optical power answers a different question.
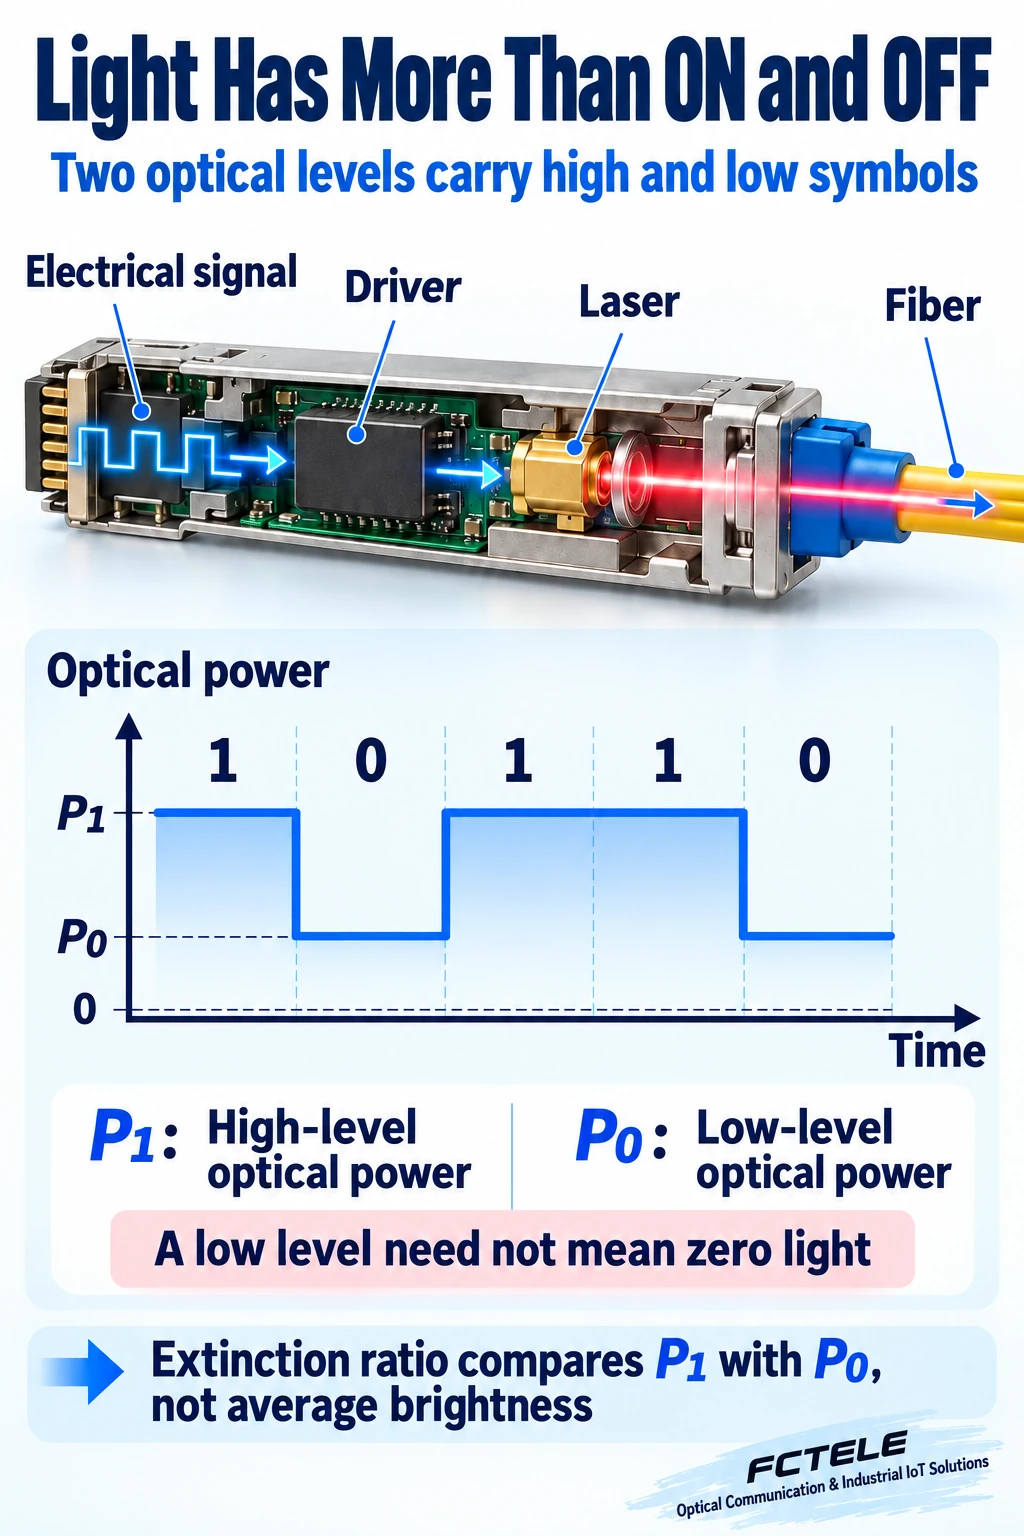
First, understand how light carries the data
In a common two-level, intensity-modulated optical link, the transmit circuit passes digital changes to a light-source driver. The driver makes the laser produce different optical power levels. Light travels through fiber to a photodetector, which turns changes in light into changes in current. Further circuitry then recovers the data. Stronger and weaker refer to optical power, not to coloring the fiber differently.
This explanation uses a common non-return-to-zero, or NRZ, two-level representation. Think of it as high and low levels representing symbols, with a level allowed to stay unchanged across adjacent intervals. Real links also have coding and receive processing; each apparent on/off event should not be treated as a character typed by a user. Multilevel and coherent optical systems cannot simply inherit every detail of this simplified illustration.
Which two levels does extinction ratio compare?
For this explanation, call the representative high-level optical power P1 and the representative low-level power P0. Extinction ratio compares their ratio and is often abbreviated ER. When the light remaining at the low level is smaller relative to the high level, that ratio is generally larger. Understanding that relationship is more useful initially than memorizing a conversion formula.
Low does not necessarily mean completely dark. A source may still emit light at the low level, and its operating conditions and driver affect the waveform. Continuous average output therefore does not prove that a port is not sending data. Nor does forcing the low level to zero necessarily improve everything. Compliance depends on the relevant optical-interface requirements, not a universal target invented for every module.
Why average brightness cannot replace level contrast
Imagine two lamps switching at the same rhythm. One has a bright high setting and a dim low setting. The other is only slightly brighter at high and remains fairly bright at low. With equal time at each setting, the two signals can have the same average brightness but different level separation. This analogy explains averages and two levels; an actual optical receiver does not inspect a lamp with human eyes.
An ordinary optical power meter mainly reports average optical power at its input. It is useful for checking loss and the receive range, but it does not unfold every fast high and low plateau. A module diagnostic receive-power value is not automatically an extinction-ratio measurement either. Even with a normal value, correlate errors, connector condition, reflections, timing and device state before reaching a conclusion.
The transmitted pattern also matters to an average. If high and low occur in different proportions in two tests, average power can change even when the levels themselves do not. The illustration deliberately assumes the same duty cycle: the same proportion of time at high and low. It shows that one average does not identify a unique two-level combination, not that every service data stream has an unchanging average power.
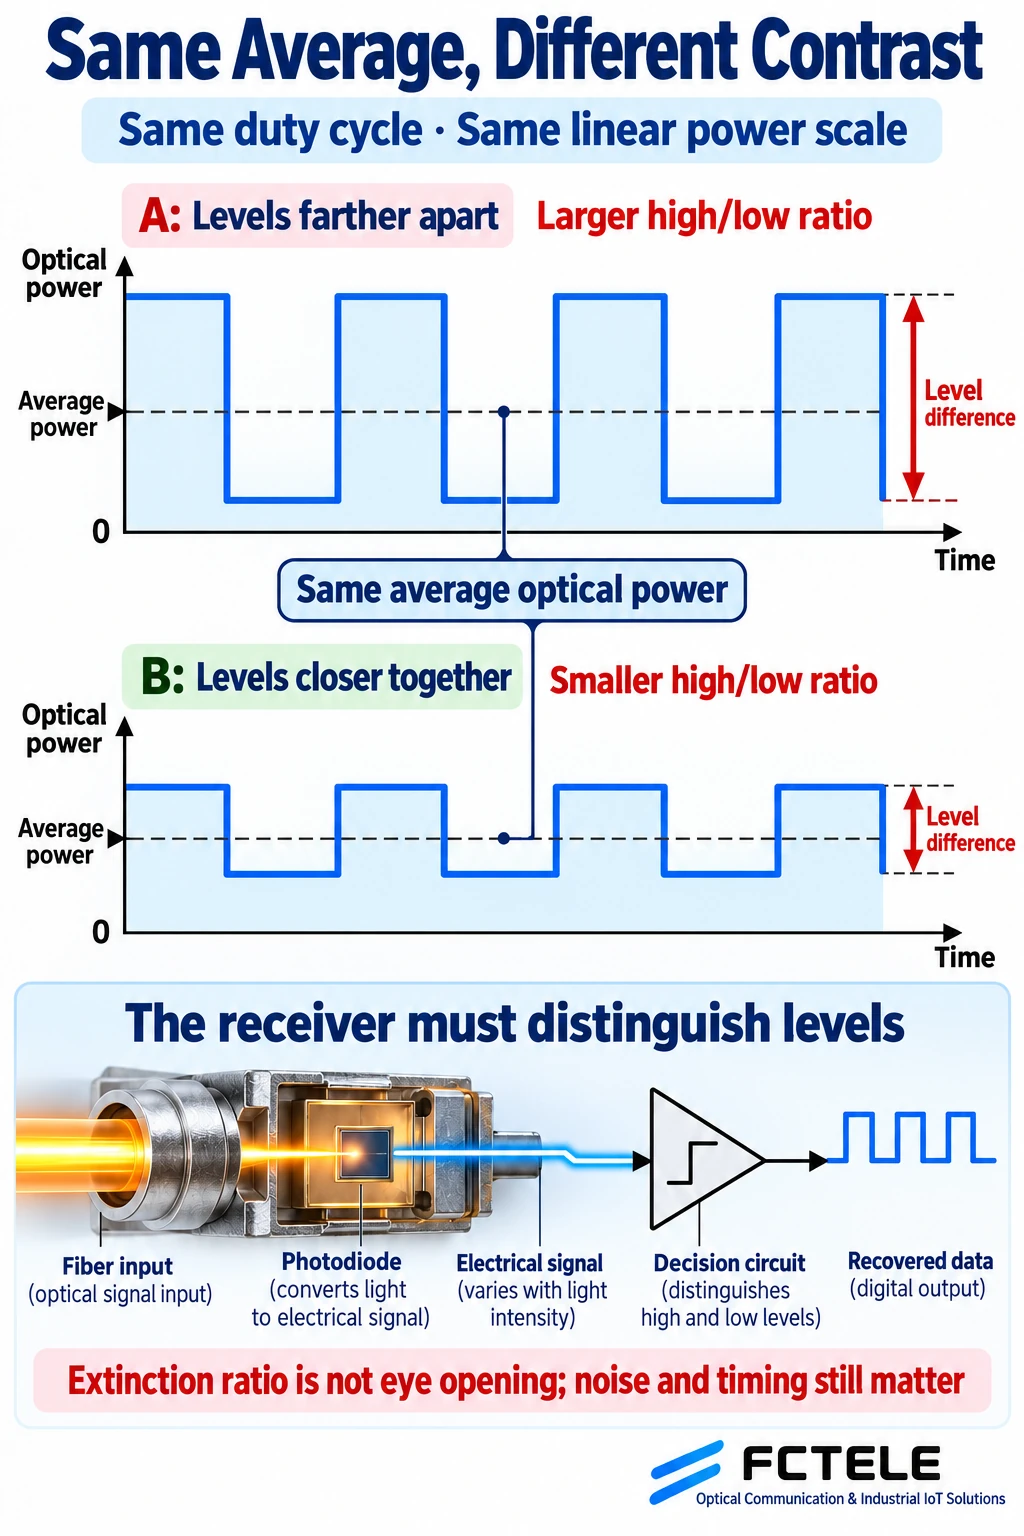
Keep extinction ratio, modulation amplitude and eye quality separate
The ratio of two levels and the optical-power difference between them are different descriptions. The latter is commonly discussed as optical modulation amplitude, or OMA. One describes a relative level relationship; the other describes modulation amplitude. They cannot replace one another merely because both appear in an optical specification. dBm usually expresses a power level, while dB is commonly used for a ratio. Equal-looking numbers across different measures are not directly comparable.
An eye diagram overlays waveforms from many symbol intervals to help reveal amplitude, noise and timing spread. Extinction ratio concerns the ratio of representative high and low levels under defined conditions; it is not the opening of the entire eye. Separated average levels do not guarantee that every sampling decision is unaffected by noise or timing. Passing extinction ratio alone also does not prove an error-free link.
Which measurement conditions can mislead you?
Extinction-ratio measurement needs a suitable optical test system that can resolve the fast waveform and determine levels using the applicable method. Dark-level offsets, calibration, bandwidth, the reference receiver and the test pattern can affect the result. Dark level can be understood initially as an instrument offset remaining without the signal. Ignoring it can distort the interpretation of a very low optical level.
Results from different test ports, wavelength settings, rates or patterns should not be placed in a table as if the conditions were identical. Site engineers need not buy a sampling oscilloscope for every intermittent fault. They do need to know what a power meter has not answered. Providing the conditions to the supplier or laboratory is much clearer than supplying only a screenshot saying that light is present.
Also distinguish transmitter testing from observation at the receiving end. A transmitter extinction-ratio result under specified conditions is evidence about the launch waveform. After the actual route, the receiver faces a signal influenced by the path. Mark the location and time of receive-power readings, transmitter reports and receive-side error counters. Do not combine readings from different locations into a supposed simultaneous measurement.
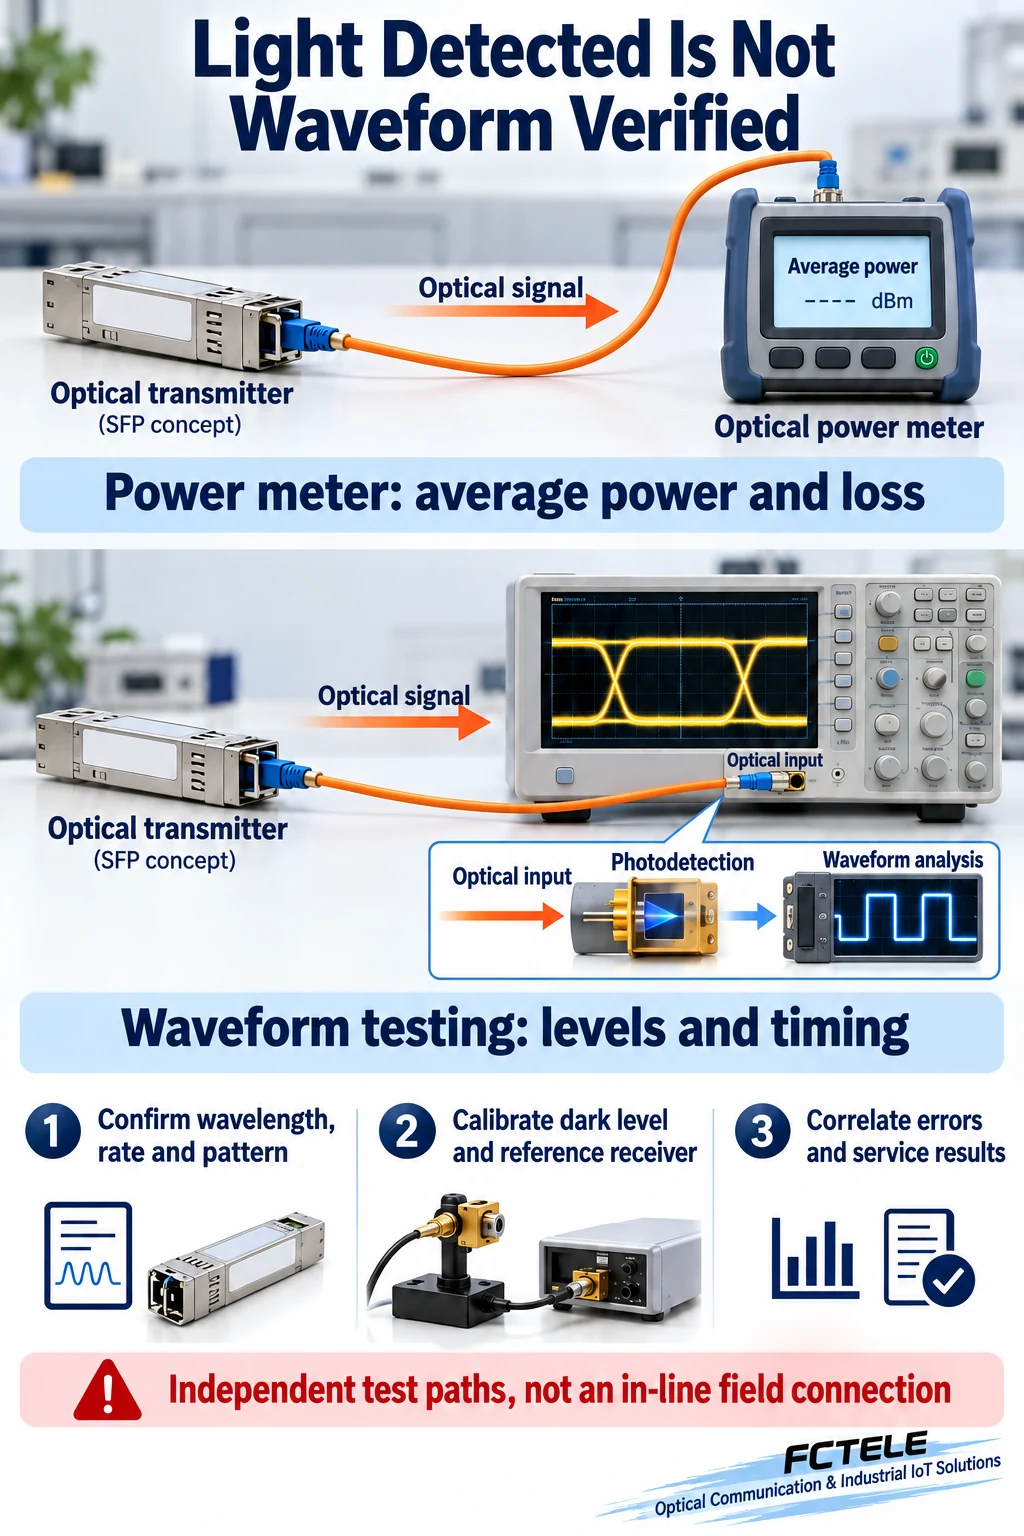
A step-by-step site investigation
First verify the actual module, port rate, fiber type, wavelength and host compatibility. Second inspect and clean connector ends using the appropriate procedure and check the patch cords and connections. Third record transmit and receive power in both directions and compare with the selected model’s allowed conditions. Watch for both weak reception and receiver overload. Do not bend fiber arbitrarily to reduce power.
Fourth correlate error counters, link logs and the service symptoms. Is the entire link repeatedly rebuilding, or does it remain established while bad frames appear? In an approved maintenance window, substitute known compatible spares one item at a time while holding other conditions unchanged. A symptom following a module is a reason to investigate that module, not a direct extinction-ratio result. Normal receive power alone does not identify the cause.
Fifth, if the transmit waveform remains suspect, collect the module documentation, firmware or hardware versions, environment, supply conditions, fault conditions and earlier records. Ask a capable testing party to verify the relevant optical-interface method. Correlate errors, waveform evidence and power; one number cannot replace the complete evidence. This is an investigation order, not a factory acceptance procedure for every product.
Consider a site example without invented product values: both optical ports connect, power lies within the documented range, yet service occasionally fails. Save the failure times and investigate connector contamination, supply changes or other common conditions. Replace a verified patch cord while keeping the module; replace the module while keeping the route. Such controlled comparisons narrow the scope but do not measure extinction ratio. Without the instrument, record a suspected waveform or module issue pending verification, rather than presenting a guess as a measurement.
Apply the principles to real product documentation
The FCTEL website lists industrial switches with SFP ports, including an industrial managed device with 24 Gigabit copper ports and the documented Gigabit optical/copper combination interfaces. SFP describes a pluggable form factor. Supported modules, wavelengths and test conditions must still come from the selected host and module documentation. Similar shape does not establish interchangeability.
An omitted specification does not mean that the parameter is irrelevant or that the product necessarily fails it. Identify the optical interface and intended module, then request documentation that can support acceptance under the relevant conditions. Integrated fixed optical ports and pluggable SFP ports can have different maintenance arrangements. Do not adjust source bias or driver parameters without the applicable instructions and evidence.
For a media converter, optical multiplexer or switch, acceptance should separately confirm media and interface compatibility, reception within the allowed range, stable recovery of data and satisfactory service behavior. This article explains a foundation for signal interpretation. It supplies no measured extinction ratio for a FCTEL product and does not turn another manufacturer’s instrument documentation into a FCTEL product commitment.
Remember the intuitive distinction: average optical power asks whether a room is bright overall; extinction ratio asks about relative contrast between two settings. Eye and error measurements go on to ask whether changes are clear, timely and correctly recovered. Separate those questions to avoid assuming that the presence of light guarantees good data.
Sources and scope: generic NRZ concepts and hypothetical illustrations, not FCTEL measurements. Multilevel interfaces use their applicable definitions. Checked October 20, 2026. See Keysight: Extinction Ratio, Average Power, and NRZ measurement overview. FCTEL industrial switch documentation (Chinese) identifies the selected device’s interfaces; this article adds no undocumented capability. Diagrams are AI-assisted original conceptual illustrations.
Translated from the Chinese technical article: Read the original Chinese article.
Common practical questions
Does normal optical power prove that extinction ratio passes?
No. A power meter or diagnostic receive-power value mainly describes average power, not representative fast high and low levels. Extinction ratio needs suitable waveform testing under defined conditions, alongside error evidence and path checks.
Must the low optical level be completely dark?
No. A low level may retain optical output. Judge it against the relevant interface requirements; forcing it to zero is not a universal target and does not justify undocumented driver adjustments.
Does a larger extinction ratio guarantee a better link?
No. Modulation amplitude, waveform timing, noise, receiver range and actual errors also matter. Extinction ratio is not complete eye opening or a universal acceptance threshold for every product.
Scope and further reading
Generic NRZ optical principles, conceptual illustrations and controlled investigation examples; no product measurements or universal acceptance limits.
